

In the current year, the Indian stock market (Nifty-50) has delivered a return of just 2.73% while if we look at the post-Corona numbers. On 3rd January 2022, Nifty was trading around the 17,812 level and ended the year 2022 on the same level of 17,859, while in 2023 the Nifty gained a whopping 21% ending on the level of 21,731, and in September 2024, Nifty reached an all-time high of 26,277, ending the year on the 24000 level, delivering a return of around 9%.
Fast forward today, amidst all the trade wars, tariffs, and market sentiments, Nifty-50 is hovering around the 25,500 level for the last one year and was seen dropping to the level of 22500 in February-March.
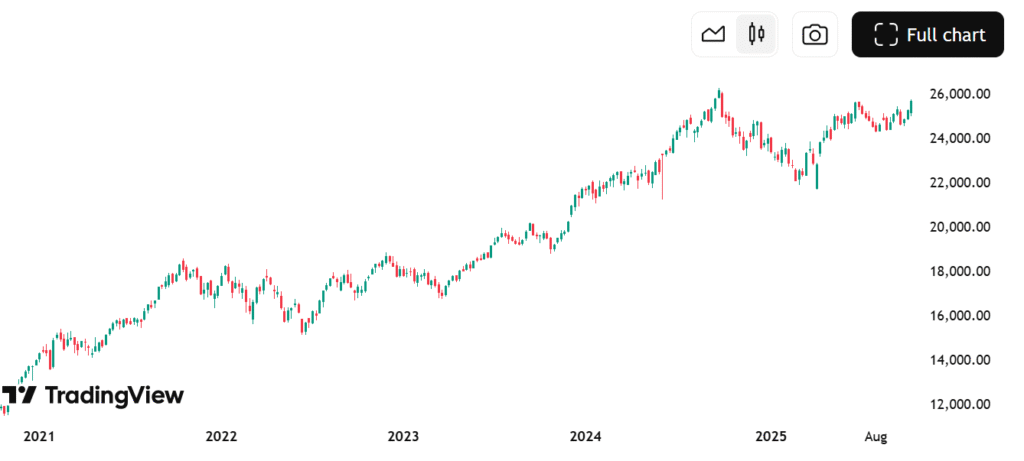
Table of Contents
Financial Markets in 2025
It’s been an interesting year for stocks, as economic headwinds and shocks have mounted, with tariffs, wars and politics all adding to the mix. As seen after the first quarter of 2025, it looked like financial markets would succumb to the pressure of bad news, but stock markets have come roaring back, surprising market experts and economists. But is this level sustainable? That’s the real question.
Moving forward, there is a pragmatism among investors, big hedge funds, and institutional investors about the possibility of correction in a market. Jamie Dimon, head of US bank JP Morgan Chase, quoted “I am worried about the global economy”.
Discounted Cash Flow(DCF)
The basis of dcf model is that you expect companies to give positive cash flows after all the required reinvestments. while discounting the cash flow, you pick your time period, and then you reach the terminal value, assuming that the company/index will grow at that rate in perpetuity(g). Then you sum up all the cash flows and discount them at the required rate of return.
Nifty-50 Numbers
Nifty on average has given EPS of around 1110-1120 in 2025, while the dividend payout ratio has been historically high with 42.80% in recent quarter. I expect these numbers to continue to grow.
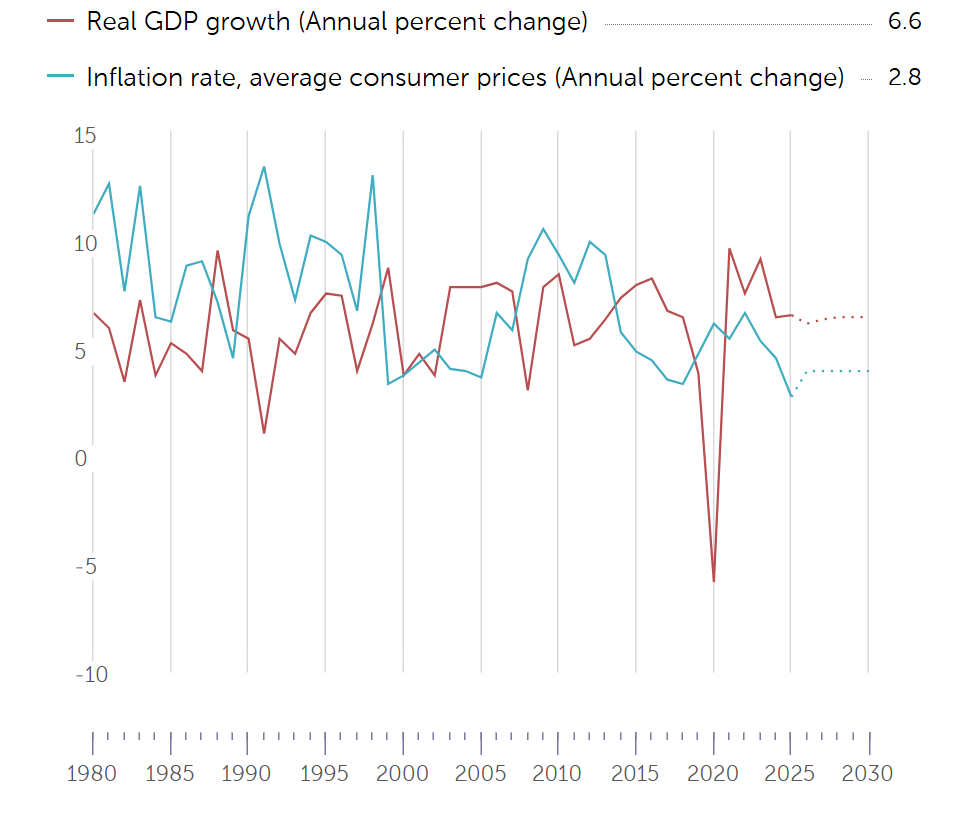
Looking at global data, the IMF predicted the Indian economy to grow at a pace of 6.6% and with long-term growth at 6.5%, but we all know how these numbers change every week, which makes predictions slightly biased in the short run, but things do hold if we go in the long run.
Considering the broder index to perform equivalent to the growth rate, our long-term perpetual growth rate should be around the same number, while in the short run from year 1-5, we can expect Nifty to grow at a higher pace.
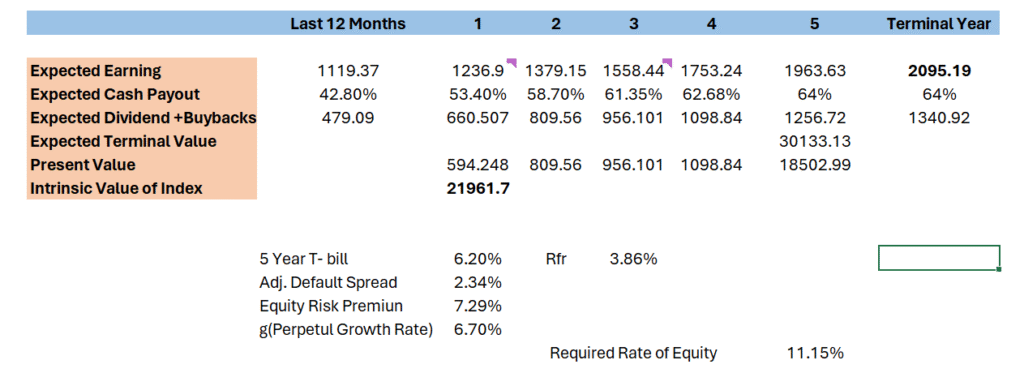
As the market matures, the company will start to pay out more and more dividends, and maybe we will see potential buybacks also in the Indian market. We do see sometimes buybacks happen in the Indian market, but not as much as when we compare it to the American market.
With that, you can see an assumption of net 64% payout and a perpetual growth rate of 6.7%, we reach a value around 22,000, while as I write the nifty is trading at the level of 25,868 indicating the market is overvalued by around 17%, so I won’t be surprised if I see market correction of about 12-14%.
Now, let’s look at it from another perspective.
The Yardeni Model
The Yardeni model is a valuation model used to determine whether the overall stock market is overvalued or not. The Yardeni model starts from the Fed model and adds growth components to the analysis.
Components of the Yardeni Model
CEY: Current earnings yield of the market
CBY: Current Moody’s A-rated corporate bond yield
LTEG: Long-term earnings growth
k: Constant assigned by the market to the earning yield.
Formula for the Yardeni Model

We can take the reciprocal to obtain the P/E ratio.
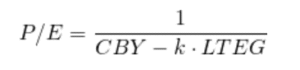
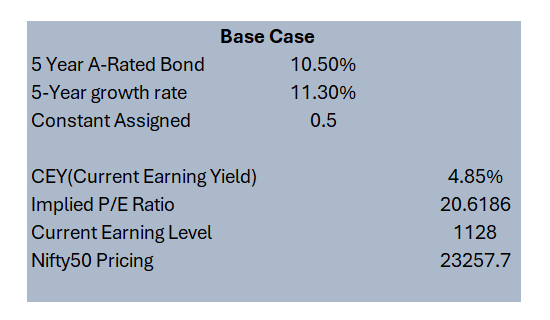
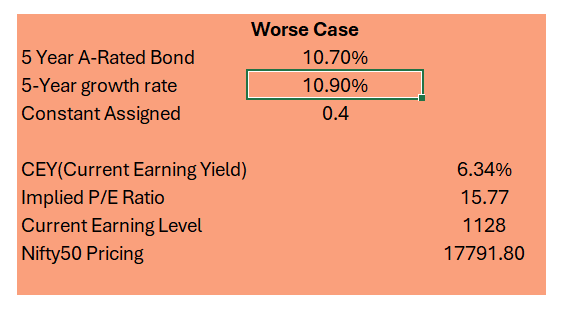
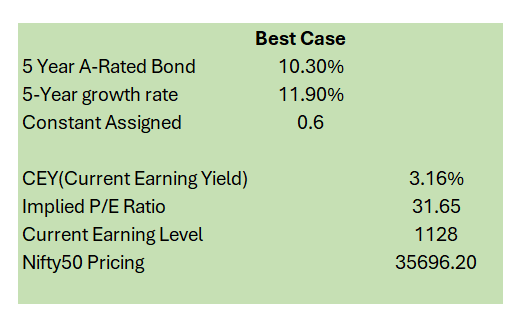
Now, plugging the required numbers to get the P/E ratio of the Nifty, with base, worst and best case scenarios.
Yardeni Model Interpretation
The model indicates that the P/E ratio of the market is negatively related to the interest rate and positively related to the growth rate. In the case of Nifty, the 5-year growth rate for the base case scenario is taken as 11.3%, which I believe will be somewhere around the required rate of return using CAPM.
With a 5-Year A-rated bond ranging from 10.3%-10.7% and a growth constant between 0.4 to 0.6, I can see the fair pricing of Nifty to be around the 23,500 level, which is around 6% greater than what we get using the DCF model, but still not near the current level of 25,800.