
Price Trends: Gold and silver prices have sharply changed since late January 2026 due to a decline in both precious metals after reaching record highs earlier that month (Gold = $5,602 per ounce; Silver = $121 per ounce). Gold has lost about 11% of its value from late January and is currently trading around $4,871 per ounce as of February 5, 2026 (+8.4% in February). Silver also experienced a significant decline after reaching a January record high with an approximate value of $76.70 per ounce (-5.6% in February) following a peak in late January where silver was valued at approximately $121.00 per ounce (+68.5% in January). Both precious metals experienced a sudden decline causing gold to dip below the “support” level of $5,000 per ounce and silver to decline below $100 per ounce. The Associated Press (AP) reported that gold traded at approximately $4,745 per ounce on January 31, 2026 and that silver was trading at approximately 31.4% below its most recent highs; both precious metals continue to be valued higher compared to the same time last year (gold = +70% Y/Y; silver = +138% Y/Y).
Macroeconomic Drivers: The rise and fall of metals had largely been determined by the actions of monetary policy and macroeconomic changes. Interest rates, as well as inflation in the United States were key things driving the market over the last couple months. Late in January, however, the Federal Reserve chose not to change (3.75% upper bound) its interest rates; then President Trump unexpectedly announced the nomination of Kevin Warsh as the new Chairman of the Federal Reserve (a classic inflation “hawk”), which sent shock waves throughout global markets. Following Warsh’s nomination, United States Treasury yields rose (approximately 4.25% on the 10-year), along with an enormous jump in the value of the U.S. dollar. Additionally, the hotter-than-anticipated producer’s prices from January contributed to the overall view of a more hawkish Federal Reserve. This dynamic helped diminish demand for gold as a safe-haven investment due to the idea that the U.S. Federal Reserve would have a more aggressive approach to monetary policy and increase the value of the U.S. dollar. Separately, ongoing inflation concerns and political uncertainty throughout the U.K. caused demand for gold in the United States to increase due to its traditional status as a hedge against inflation. Thus, while the significant rally of gold prices throughout January were a result of unexpectedly high levels of inflation combined with uncertainty in the policies of central banks (and the political debate as to whether or not the Federal Reserve should remain independent), these factors are all likely to cause investors to take profits when the news regarding Fed Chair Warsh was reported.
Geopolitical & Event Risks: The influence of global uncertainty was significant in January. There were tensions regarding U.S.–Europe trade (such as Trump’s threatened tariffs on Greenland) and there were ongoing conflicts in the Middle East that resulted in investors buying gold. An example is the announcement by Trump regarding renewed diplomatic relations with Iran that likely led to a dip in the price of oil and the price of gold peaking. It should be noted that most of the gains in January were due to a wide range of geopolitical issues (including worries about Greenland and tariffs as well as uncertainty related to the Federal Reserve). Additionally, many analysts indicated that U.S. politics, primarily related to the upcoming elections, will continue to serve as a catalyst for gold prices going forward.
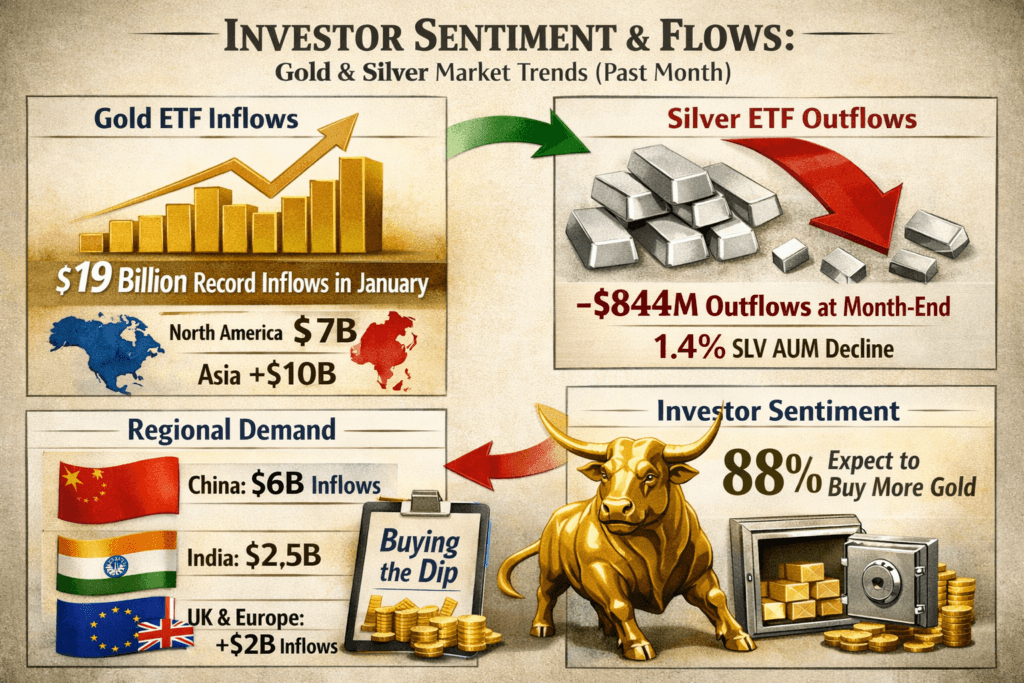
Investor Sentiment & Flows: In January, investors moved into bullion ETFs in response to a “fear trade” in many parts of the globe. The October 2023 World Gold Council records extraordinary inflows into gold ETFs, where investors deposited $19.0 billion into gold ETFs throughout the month (the highest monthly total ever) resulting in a total gold ETF AUM of $669 billion – a 20% increase. North American investors alone deposited about $7 billion (for eight consecutive months), and Asia had around $10 billion deposited in January (the largest amount deposited in any one month ever). Chinese investors constituted the largest single-country inflow with approximately $6 billion deposited, while Indian investors added another $2.5 billion in January. Additionally, the European region also experienced inflows (+$2 billion), with the United Kingdom leading the regions by virtue of rising inflation. (In contrast, there were lesser inflows from emerging markets, but they were still positive (+$0.3 billion).) The SPDR Gold Shares (GLD) and their counterparts benefited from these large inflows of gold (as reflected in WGC’s total of $19 billion), with many of the Indian gold ETFs also benefiting by virtue of record inflows during late 2025. Overall, silver ETF investor behaviour was more volatile, with the largest silver ETF, iShares Silver Trust (SLV), and experiencing large month-end outflows (~$844.6 million) as a result of panic selling in the context of rapid price corrections. Nevertheless, gold is still considered a safe-haven asset by most investors, according to WGC surveys that indicate nearly all investors are likely to add to their gold reserves, and therefore the late-January drop in the gold price presents additional opportunities for investors to add gold to their portfolios.
Futures & Options Market: Based on information from the futures market, the bullishness of the market was confirmed, but since then, the same market has been in a bearish trend. Initially gold market participants were long, and as the price fell after the end of January (due to the southward movement of the price), the posture of the traders has changed (decreasing their net positions) as shown by the data. The speculative net short positions of gold increased from about 251,200 on January 16 to about 205,400 on January 30. The trading volume for January was approximately $623 billion per day globally (up approximately 52% compared to December), while trading in the last week of January was approximately $963 billion. Many traders attempted to profit by selling February contracts as they were near the top of the market in January and some were selling options to hedge against their long term positions in anticipation of price movement being near the bottom of the market as evidenced by the option volatilities having risen dramatically and a rising bias. January, 2021 saw the highest level of worldwide trading in gold and the highest level of gold option volatility in the last decade.
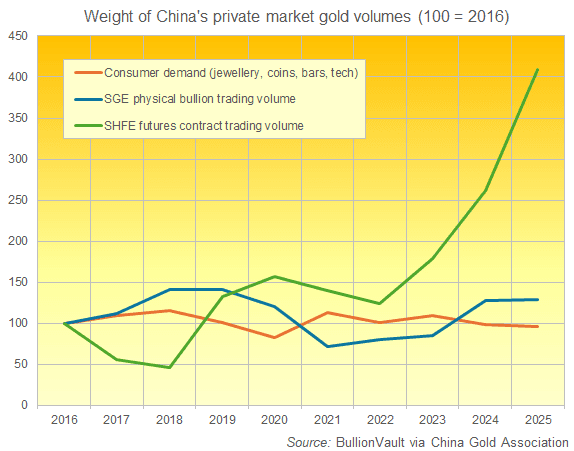
Physical Bullion Demand: There was a lot of activity in the retail bullion market. In China, household gold appetite was strong in 2025 with 950 tons purchased, but there was a shift to bar and coin purchases vs. jewellery. Thus, jewellery demand fell 31.6% year-over-year (YOY) in 2025 but bar/coin purchases increased 35.1% YOY. (According to BullionVault data, Chinese futures trading has skyrocketed while physical consumption has remained stable.) In India, the high prices for gold combined with a successful wedding season drove record demand for gold in Q4, with revenues from listed jewellers rising by nearly 37-51% YOY, mainly due to price increases; plus sales of simple plain jewellery and gold coins were booming. Overall, gold coin sales in India were almost double YOY; there was also a dramatic increase in buying bars and coins in Europe as well, but a decrease in jewellery sales.
Following what happened to silver in January, many new buyers have started to buy silver in the form of physical coins. Many coin dealers have reported record levels of purchasing (in retail outlets) since approximately mid-December. According to SD Bullion (a leading coin Dealer), the largest volume of business on a single day occurred on January 30th when there was 2.5 times more volume (transactions) than ever before.
Production and delivery issues soon developed as many sovereign mints (including the Perth Mint and the U.S. Mint) ceased new sales or lowered the amount allocated for new sales as it became difficult to keep up with increasing demand for silver coins. Many observers have noted ever-increasing premiums and delays in delivery (with lead times currently running approximately 8-10 weeks) to take care of the physical demand from buyers who were trying to buy silver following the paper sell-offs in December and January. In other words, the price crash of silver created an overwhelming amount of retail demand, or “buying the dip”, that ultimately put a tremendous strain on the wholesale bullion distribution chain.
Central Banks: In the buying of gold has remained strong into the year 2026 according to data from various institutions. Emerging-market central banks have been diversifying their reserves by acquiring significant amounts of gold in 2026 (Goldman Sachs has estimated an approximate 60 tons of official buying).
China’s central bank has been able to maintain its buying streak for 14 consecutive months (as of Dec). Other countries in Europe and around the world have experienced large amounts of official purchases (e.g., Poland purchased 102 tons of gold from Dec through the end of 2025 and will reach 700 tons). There was an overall record level of official purchases in 2022 (248.6 tons purchased by banks from Jan through March of the year 2022). Analysts expect that this trend will continue and have reported that 95% of the central bankers surveyed indicated their intentions to increase their gold reserves, and many central bankers cited 2022 as an “amazing” year regarding net purchases. There were very few sales of officially purchased gold; Singapore, Russia and other countries sold the only large amounts of gold during this time.
Conclusion: The last month has been characterized by substantial volatility in the gold and silver markets due to macroeconomic uncertainty, changes in expectations for interest rates, increasing geopolitical risk and substantial speculators. The gains from the last month have been driven by unprecedented inflows into ETFs, heavy buying by central banks, fears about inflation and ongoing geopolitical tension, while the reversal has been driven primarily by rising bond yields, a stronger US dollar, signals from central banks that they will raise rates and extensive profit-taking in the futures markets. Although a decline has occurred, the underlying fundamentals of ongoing inflation risk, continued global political instability and ongoing accumulation of gold by central banks all support a long-term bullish view for the precious metal sector as this recent decline appears to be more of a correction than a reversal in the trend.
Bibliography:
World Gold Council (WGC) Reports on Gold Market Trends and ETF Flows
Reuters Precious Metals Market News and Analysis
Kitco Metals Market Reports
Bloomberg Commodities Market Insights
BullionVault Market Commentary and Data Reports
CME Group and CFTC Futures Positioning Reports
TradingView and Market Technical Analysis Data
International Monetary Fund (IMF) and Central Bank Reserve Reports
Financial Times and Associated Press (AP) Commodities Coverage