
When you read a company’s quarterly results, the first number you usually notice is revenue. The second is net profit.
But serious investors look at something deeper — operating margin.
Why? Because operating margin tells you how strong the core business really is. It shows whether a company is efficient, competitive, and able to control costs — even before interest and taxes come into the picture.
If you are analyzing Indian stocks like Tata Consultancy Services, Infosys, or Hindustan Unilever Limited, understanding operating margin can completely change how you read financial statements.
Let’s break it down in simple, practical language.
What Is Operating Margin?
Operating margin is the percentage of revenue a company keeps after paying for its operating expenses.
Operating expenses include:
Employee salaries
Raw materials
Rent and utilities
Marketing and advertising
Administrative expenses
It does not include:
Interest on loans
Taxes
One-time gains or losses
In simple words:
Operating margin shows how profitable a company’s core business operations are.
It answers a powerful question:
For every ₹100 the company earns, how much is left after running the business?
Operating Margin Formula (Simple Explanation)
The formula is straightforward:
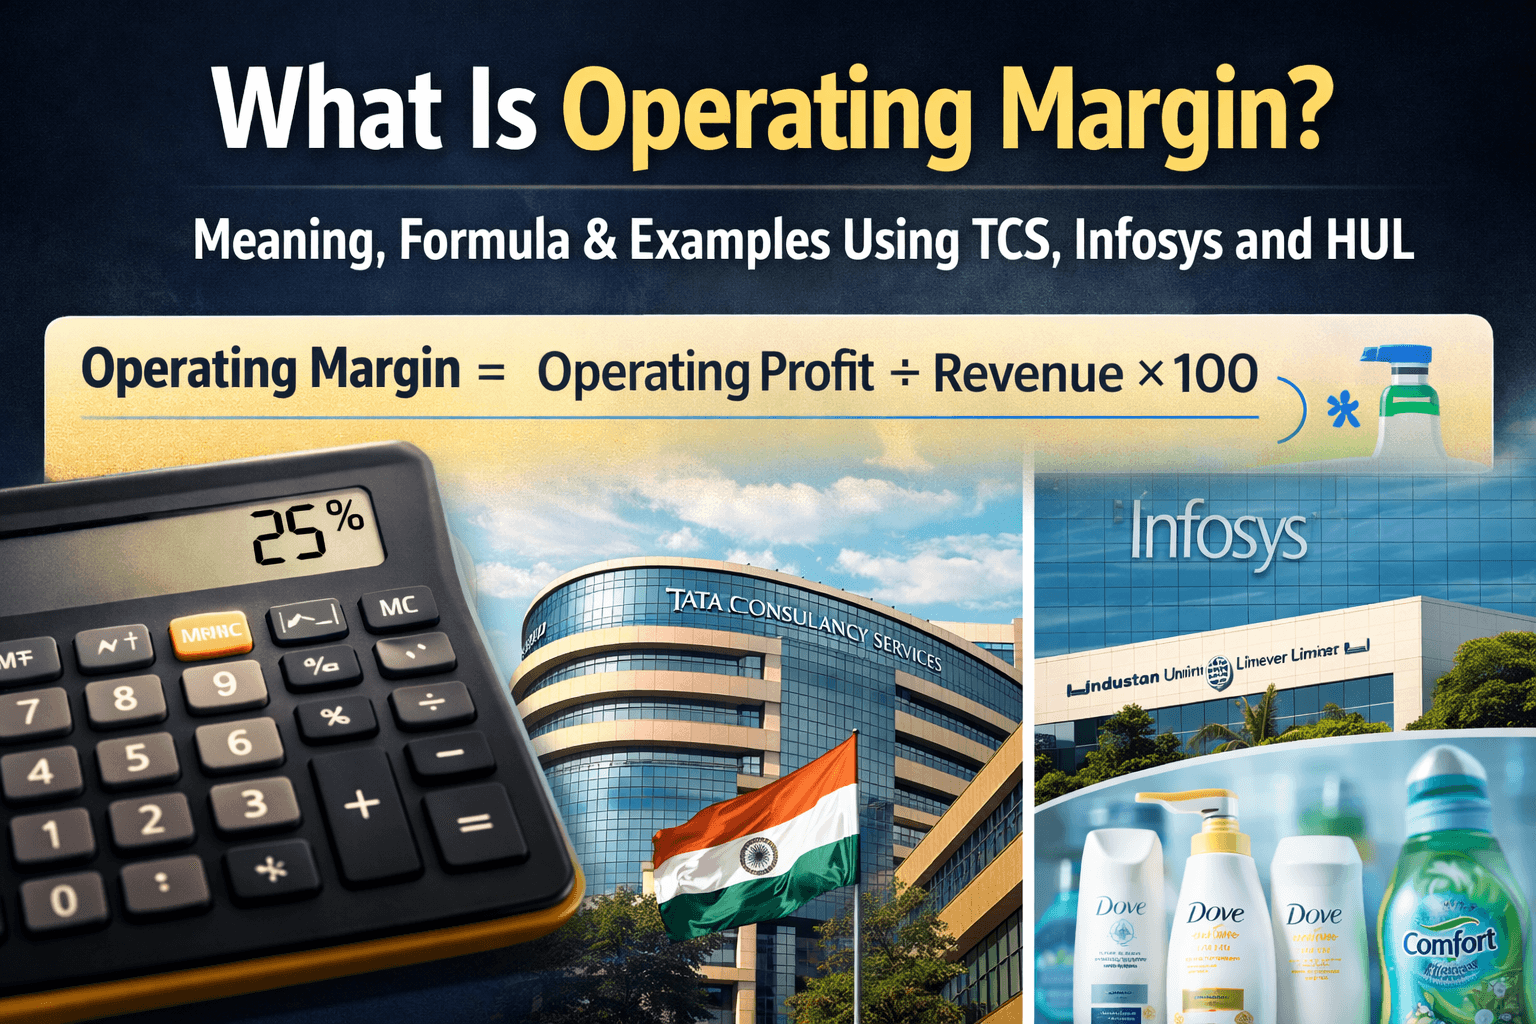
Operating Margin = (Operating Profit ÷ Revenue) × 100
Where:
Operating Profit = Revenue – Operating Expenses
Revenue = Total sales generated by the company
Example:
If a company earns ₹1,000 crore in revenue and keeps ₹250 crore as operating profit:
Operating Margin = (250 ÷ 1000) × 100 = 25%
That means the company keeps ₹25 out of every ₹100 it earns — before paying interest and taxes.
Why Operating Margin Is Important for Investors
Operating margin is one of the most important profitability ratios in stock analysis.
Here’s why:
1. It Shows Business Efficiency
Higher margins usually mean better cost control and operational discipline.
2. It Reflects Pricing Power
Companies with strong brands can charge premium prices and protect margins.
3. It Signals Competitive Strength
Stable or rising margins over time often indicate a durable business model.
4. It Helps Compare Companies
Margin comparison works best within the same sector.
For example, comparing TCS and Infosys makes sense. Comparing TCS with HUL directly does not — because industries differ.
Operating Margin Example: TCS
Tata Consultancy Services operates in the IT services sector.
In IT companies:
Employee cost is the biggest expense
There is minimal raw material cost
Businesses are asset-light
IT firms typically enjoy higher operating margins compared to manufacturing businesses.
TCS maintains strong margins due to:
Large offshore delivery model
Efficient workforce utilisation
Long-term global client contracts
High-value digital and consulting services
In IT, even small margin movements matter. A 1% change can significantly impact profits.
Operating Margin Example: Infosys
Infosys operates in the same industry as TCS.
When analysts compare Infosys and TCS, operating margin is a key metric.
If Infosys reports:
Lower margins → It may signal pricing pressure or lower employee utilization.
Higher margins → It may reflect cost control or better deal quality.
In IT services, utilization rate (percentage of employees billing clients) directly affects operating margin.
That is why margin commentary in earnings calls is closely tracked by investors.
Operating Margin Example: HUL
Now let’s look at a different sector.
Hindustan Unilever Limited operates in FMCG (Fast-Moving Consumer Goods).
Here, costs look very different:
Raw materials (like palm oil and packaging)
Advertising and branding
Distribution and logistics
FMCG companies usually have:
Stable but competitive margins
Exposure to commodity price fluctuations
Strong dependence on pricing power
Unlike IT companies, FMCG firms deal with physical supply chains and raw material volatility.
That’s why operating margins vary by industry.
What Is a Good Operating Margin?
There is no single “good” operating margin number.
It depends on the sector:
IT services → Generally higher margins
FMCG → Moderate but stable margins
Manufacturing → Lower margins due to high input costs
Retail → Thin margins
The real indicator of strength is consistency.
A company with stable margins over 5–10 years is usually more reliable than one with fluctuating profitability.
Operating Margin vs Net Profit Margin
Many beginners confuse these two.
Here’s the difference:
Operating Margin = Profit from core business operations
Net Profit Margin = Final profit after interest, tax, and all expenses
Operating margin shows how strong the business model is.
Net margin reflects overall financial structure.
For long-term investors, operating margin often gives earlier warning signals.
Why Operating Margins Change
Margins improve when:
Costs are controlled
Efficiency improves
Automation increases productivity
Companies raise prices
Margins decline when:
Raw material prices rise
Wage costs increase
Demand weakens
Competitive pricing pressure intensifies
That’s why tracking margin trends across quarters is critical.
How to Use Operating Margin in Stock Analysis
Here is a practical checklist:
✔ Compare margins with industry peers
✔ Check 5-year historical margin trends
✔ Read management commentary on margins
✔ Watch for sudden margin expansion or contraction
✔ Ensure revenue growth is supported by stable margins
If revenue rises but margins fall sharply, profitability may not sustain.
Final Takeaway
Operating margin is one of the most powerful financial ratios for investors.
It tells you:
How efficient a company is
How strong its pricing power is
How resilient its business model is
Whether you are analysing IT giants like TCS and Infosys or FMCG leaders like HUL, operating margin gives you clarity beyond headline revenue numbers.
Before investing in any stock, don’t just ask:
“How fast is revenue growing?”
Ask a better question:
How much of that revenue actually turns into operating profit?
That’s where intelligent investing begins.