
Hypothesis testing is a statistical method used to determine whether there is enough evidence in a sample of data to support or reject a proposed hypothesis about a population parameter
Table of Contents
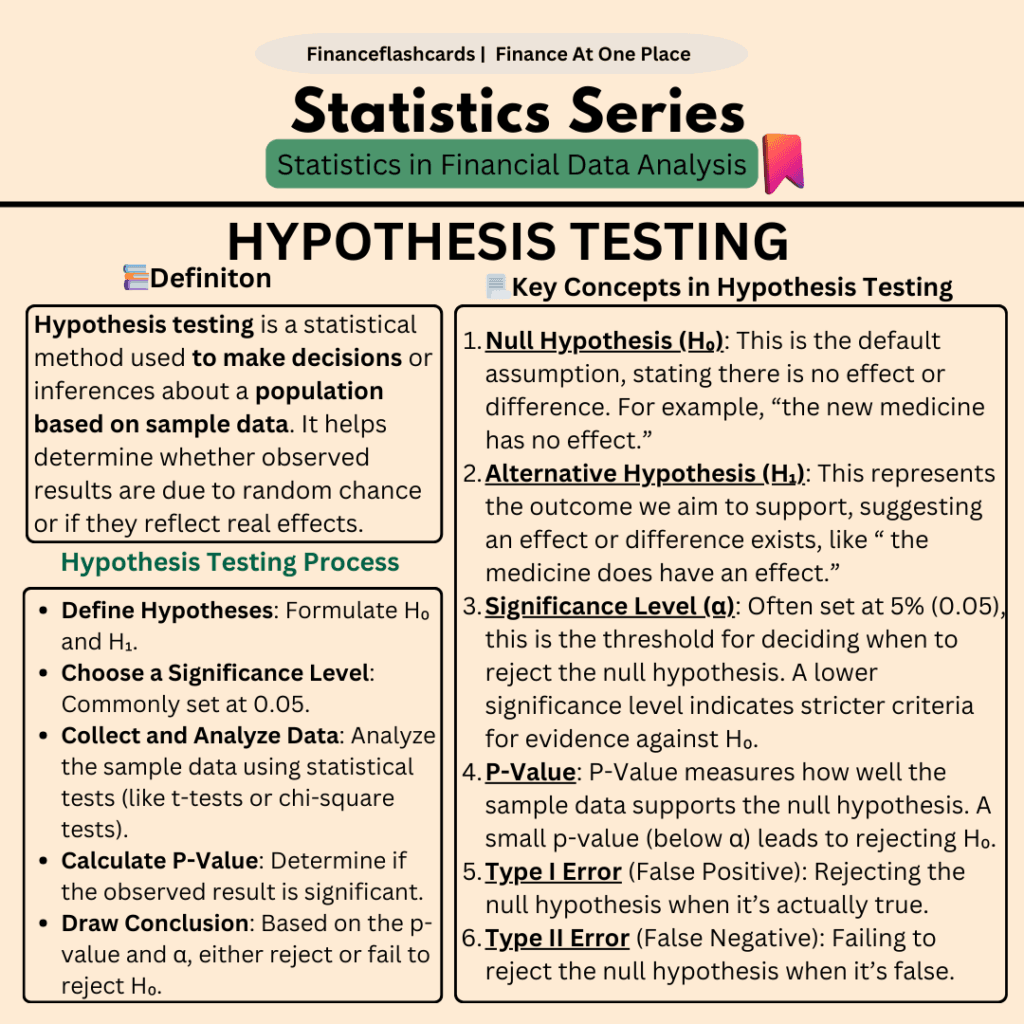
What Is Hypothesis Testing?
Hypothesis testing is a statistical method for making a decision based on experimental data. Hypothesis testing is essentially an assumption we make about a population parameter. It compares two mutually exclusive statements about a population to see which one is most supported by the sample data.

Defining Hypotheses
Null Hypothesis (Ho): In statistics, the null hypothesis represents the default assumption or a general statement indicating no relationship exists between two variables or among groups. It serves as the baseline or starting point, formulated based on prior knowledge of the problem.
Example: The average production of a company is 50 units per day, expressed as Ho:μ=50
Alternative Hypothesis (Ha): The alternative hypothesis opposes the null hypothesis, suggesting that a significant relationship or difference exists.
Example: The company’s production is not 50 units per day, expressed as Ha:μ≠50.
Key Terms of Hypothesis Testing
Level of Significance
The level of significance represents the threshold for deciding whether to accept or reject the null hypothesis. Since achieving 100% certainty is impossible, a significance level is chosen—typically 5% (Alpha=0.05). This indicates a 95% confidence level, meaning the results are expected to be consistent in 95% of similar samples.
P-Value
The p-value, or calculated probability, represents the likelihood of obtaining the observed results (or more extreme ones) assuming the null hypothesis(Ho) is true. If the p-value is smaller than the selected significance level, the null hypothesis is rejected, supporting the alternative hypothesis.
Test Statistic
The test statistic is a numerical value derived from the sample data in a hypothesis test. It assesses whether to reject the null hypothesis by comparing it to a critical value or the p-value.
Critical Value
A critical value is a predetermined cutoff point in hypothesis testing. It separates the regions where the null hypothesis is rejected or not rejected, helping to evaluate the statistical significance of the results.
Degrees of Freedom
Degrees of freedom refer to the number of values in a calculation that are free to vary. They are associated with sample size and are crucial in determining the shape of the statistical distribution used in hypothesis testing.
What are Type I and Type II errors in Hypothesis Testing?

Steps To Perform Hypothesis Testing
State the Hypotheses:
- Null Hypothesis(Ho): Assumes no effect or no difference.
- Alternative Hypothesis (Ha): Opposes the null and represents the effect or difference.
Choose the Significance Level (α):
- Typically set to 0.05 (5%), which means a 5% risk of committing a Type 1 error. The p-value is the criterion used to calculate our significance value.
Select the Appropriate Test:
- Based on the type of data and sample size (e.g., z-test, t-test, chi-square test).
Calculate the Test Statistic:
- Use the formula for the chosen test to compute the value from sample data.
Determine the Critical Value or P-Value:
- Find the threshold (critical value) from statistical tables or calculate the p-value.
Compare Test Statistic with Critical Value:
- If the test statistic exceeds the critical value or the p-value is less than α, reject Ho.
Draw a Conclusion:
- State whether you reject or fail to reject the null hypothesis and interpret the result in the context of the problem.
Example of Hypothesis Testing
Scenario:
A company claims the average time taken to assemble a product is 30 minutes. A researcher suspects it is different. A sample of 25 workers is taken, and the average time is found to be 32 minutes with a standard deviation of 4 minutes. Test this claim at a significance level of α=0.05.
State the Hypotheses:
- Null Hypothesis (H0): μ=30 (The average assembly time is 30 minutes).
- Alternative Hypothesis (H1): μ≠30 (The average assembly time is not 30 minutes).
Choose the Significance Level (α):
- α=0.05
Select the Test:
- Use a t-test because the population standard deviation is unknown, and the sample size is small (n<30).
Calculate the Test Statistic:

5. Find The Critical Value
- Degrees of freedom = n−1=25−1=24
- From the t-table, for a two-tailed test at α=0.05, the critical value is approximately ±2.064,
6. Compare the Test Statistic with the Critical Value
- The calculated t=2.5 is greater than the critical value 2.064
7. Conclusion
- Since t = 2.5 exceeds 2.064, reject the null hypothesis (H0)
There is sufficient evidence to conclude that the average assembly time is significantly different from 30 minutes.