
Volatility refers to the degree of variation or dispersion in a data set, often measured by standard deviation. It shows how much values deviate from the mean over a period.
Table of Contents
What Is Volatility?
Volatile assets are often considered riskier than less volatile assets because the price is expected to be less predictable.
Understanding Volatility
High volatility indicates large, rapid price swings, which are frequently influenced by market news, economic events, and investor sentiment. In contrast, low volatility indicates more stable and predictable price movements.
In finance, volatility is crucial for assessing investment risk, pricing options, and understanding market behavior.
Volatility is determined either by using the standard deviation or beta. Standard deviation measures the amount of dispersion in a security’s prices. Beta determines a security’s volatility relative to that of the overall market.
How to Calculate Volatility
- Gather the security’s past prices.
- Calculate the average price (mean) of the security’s past prices.
- Determine the difference between each price in the set and the average price.
- Square the differences from the previous step.
- Sum the squared differences.
- Divide the squared differences by the total number of prices in the set (find variance).
Sample Calculation
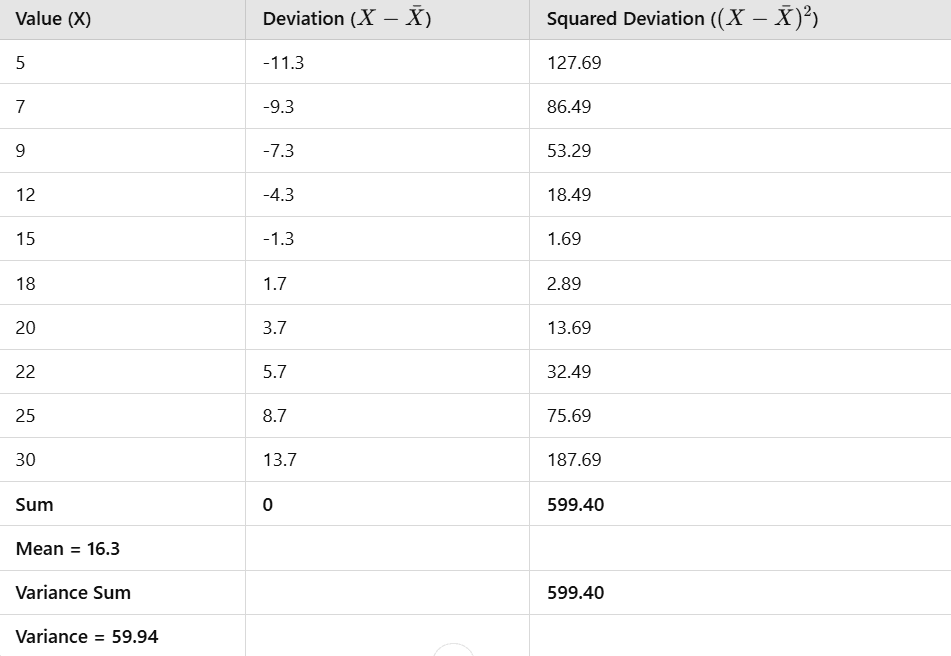
Since volatility describes changes over a specific period, you simply take the standard deviation and multiply that by the square root of the number of periods in question
Volatility = σ√T
For a trading period of 250 days, volatility will be (59.94*sqrt(250)).
Types of Volatility
Historical Volatility
Historical volatility is a backward-looking metric, meaning it analyzes past market behavior to assess the level of risk or uncertainty based on previous price movements.
This measure helps investors understand how volatile an asset has been in the past, which can inform future risk assessments and portfolio decisions.
Implied Volatility
Unlike historical volatility, which is based on past data, implied volatility is forward-looking and is often used to gauge market sentiment. It is calculated by inputting an option’s current market price into pricing models like Black-Scholes or binomial tree models and solving for volatility.
Higher implied volatility suggests greater expected price swings or uncertainty, while lower implied volatility indicates more stability.
The VIX
A higher VIX value indicates greater expected volatility and market uncertainty, whereas a lower VIX suggests a more stable market. The VIX is widely used as a measure of market sentiment and investor fear, with rising values typically indicating market downturns or increased risk.
Closing thoughts
The VIX gauges market sentiment, highlighting fear or uncertainty. Understanding volatility helps investors manage risk and identify opportunities in changing market conditions.